View Data from the Console
View Data from the Console
- Go to your Node's dashboard.
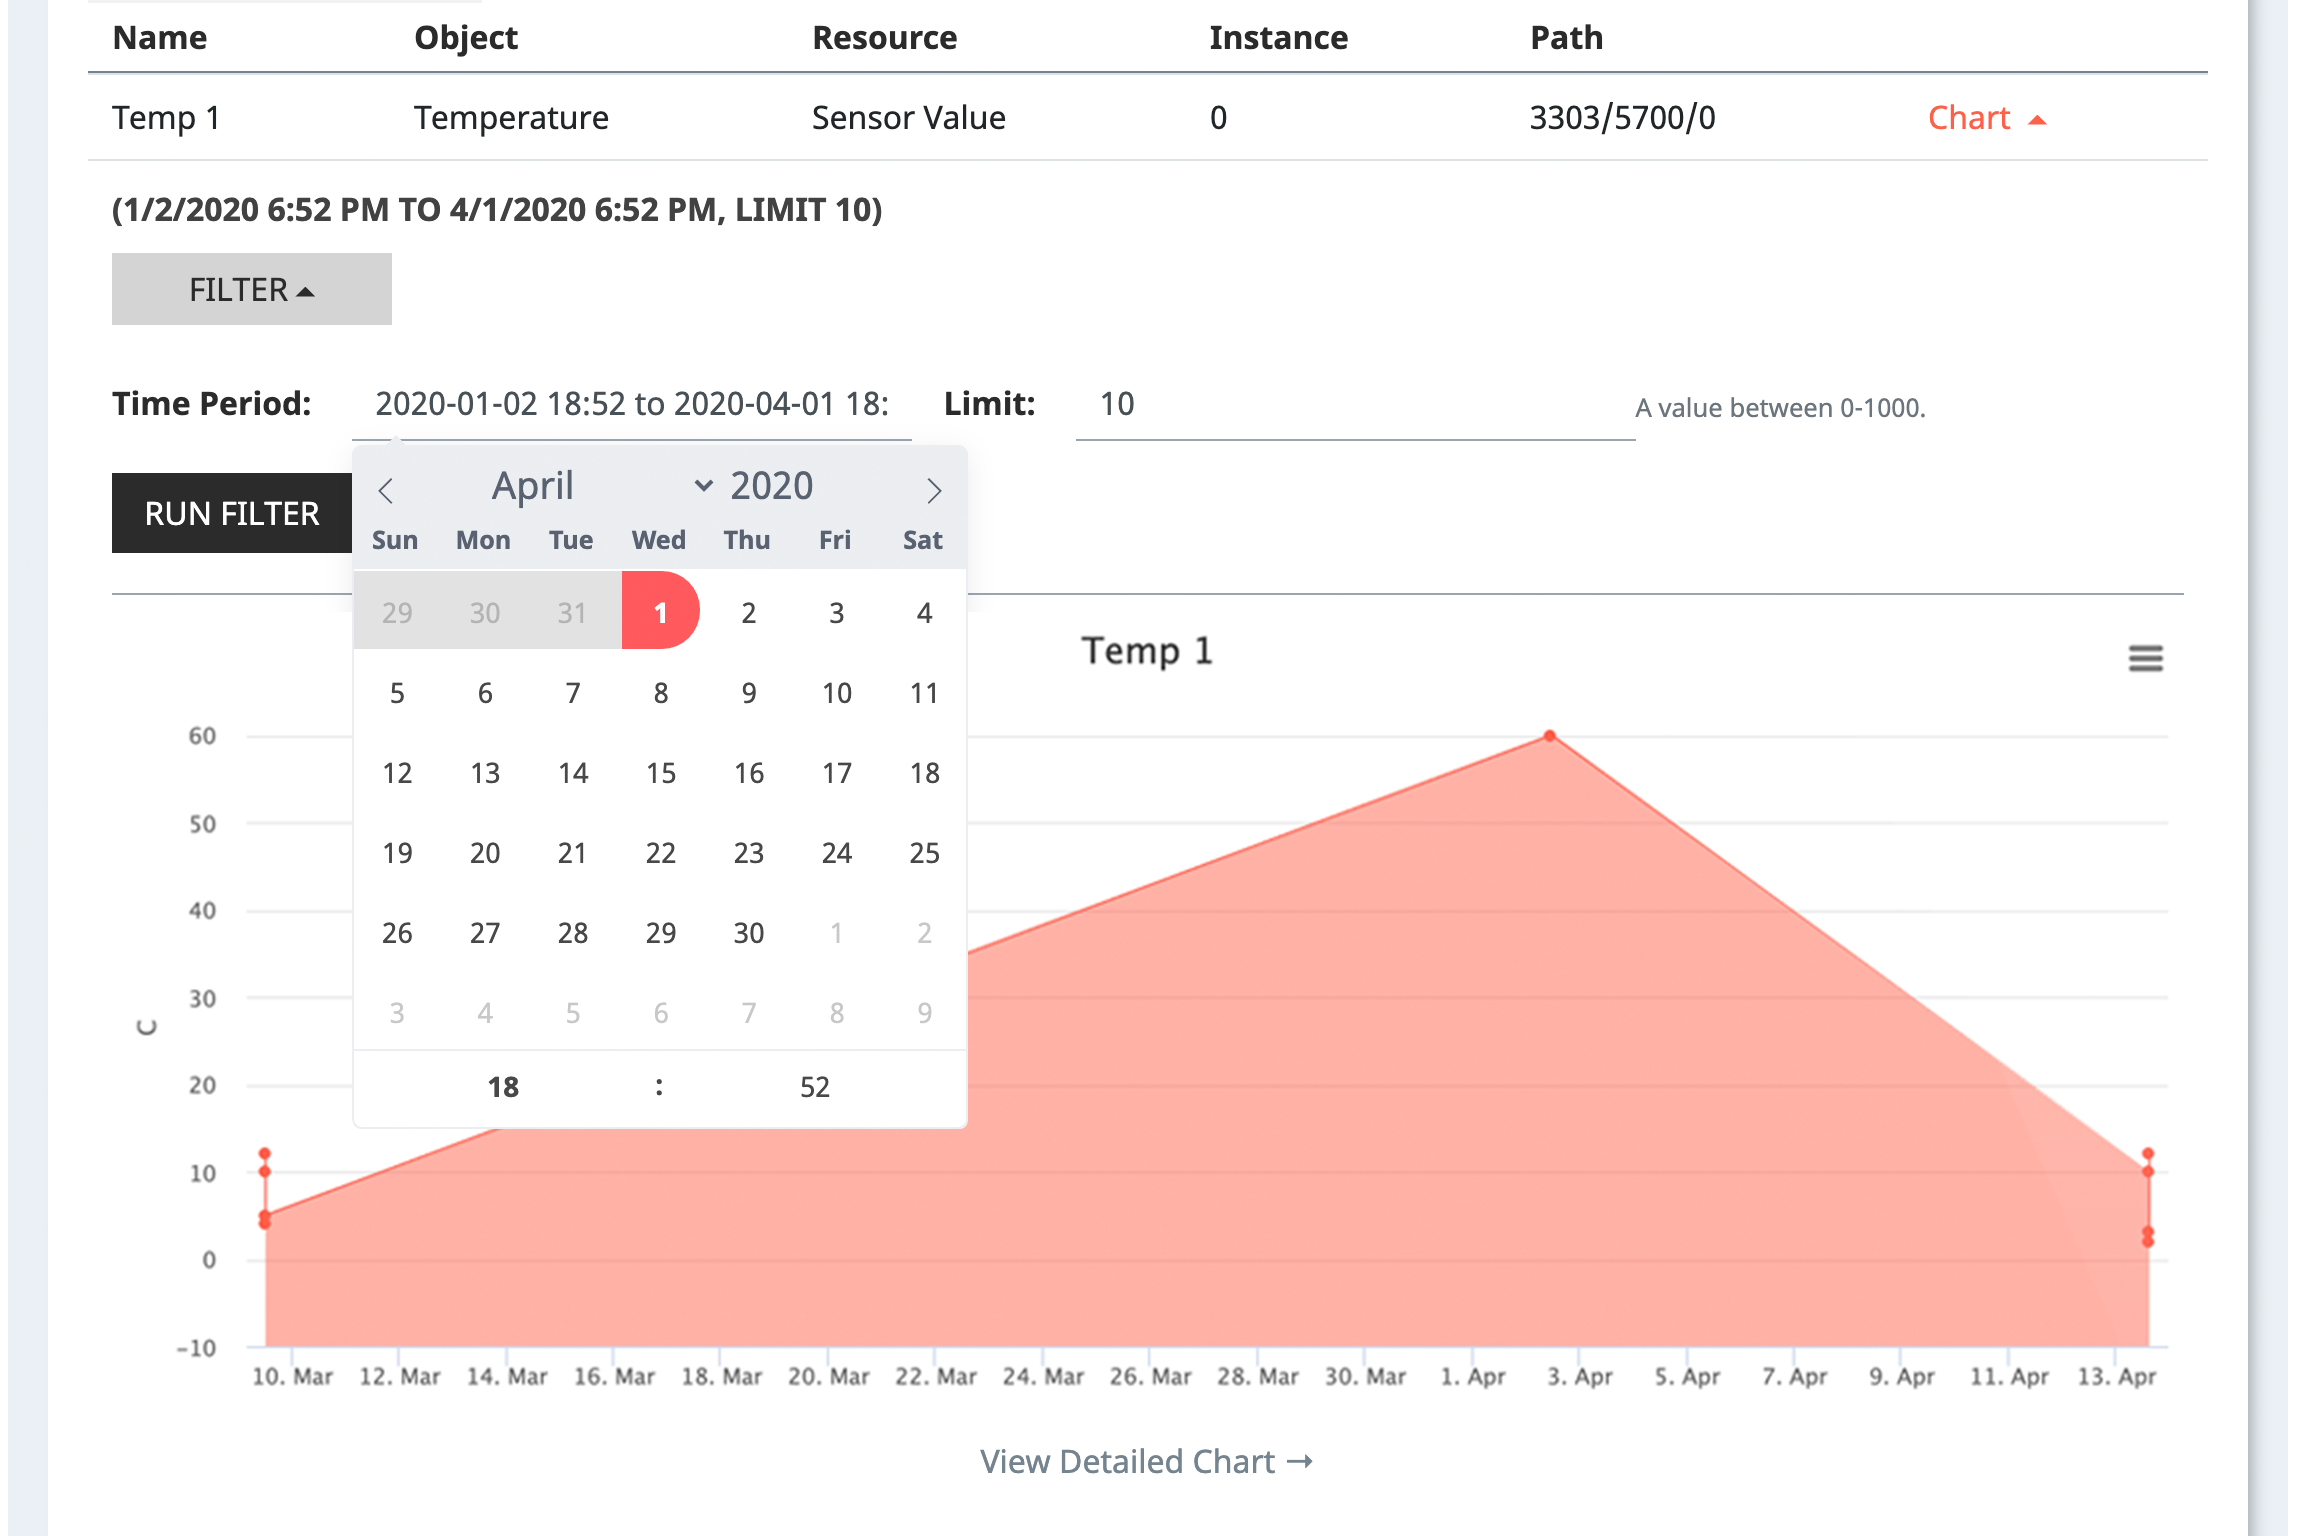
- From the Components list, click on the bolded "Chart" text to reveal the graph:

- Filter the dates of data you wish to confirm. You can also set the desired count of data points by setting a "limit".

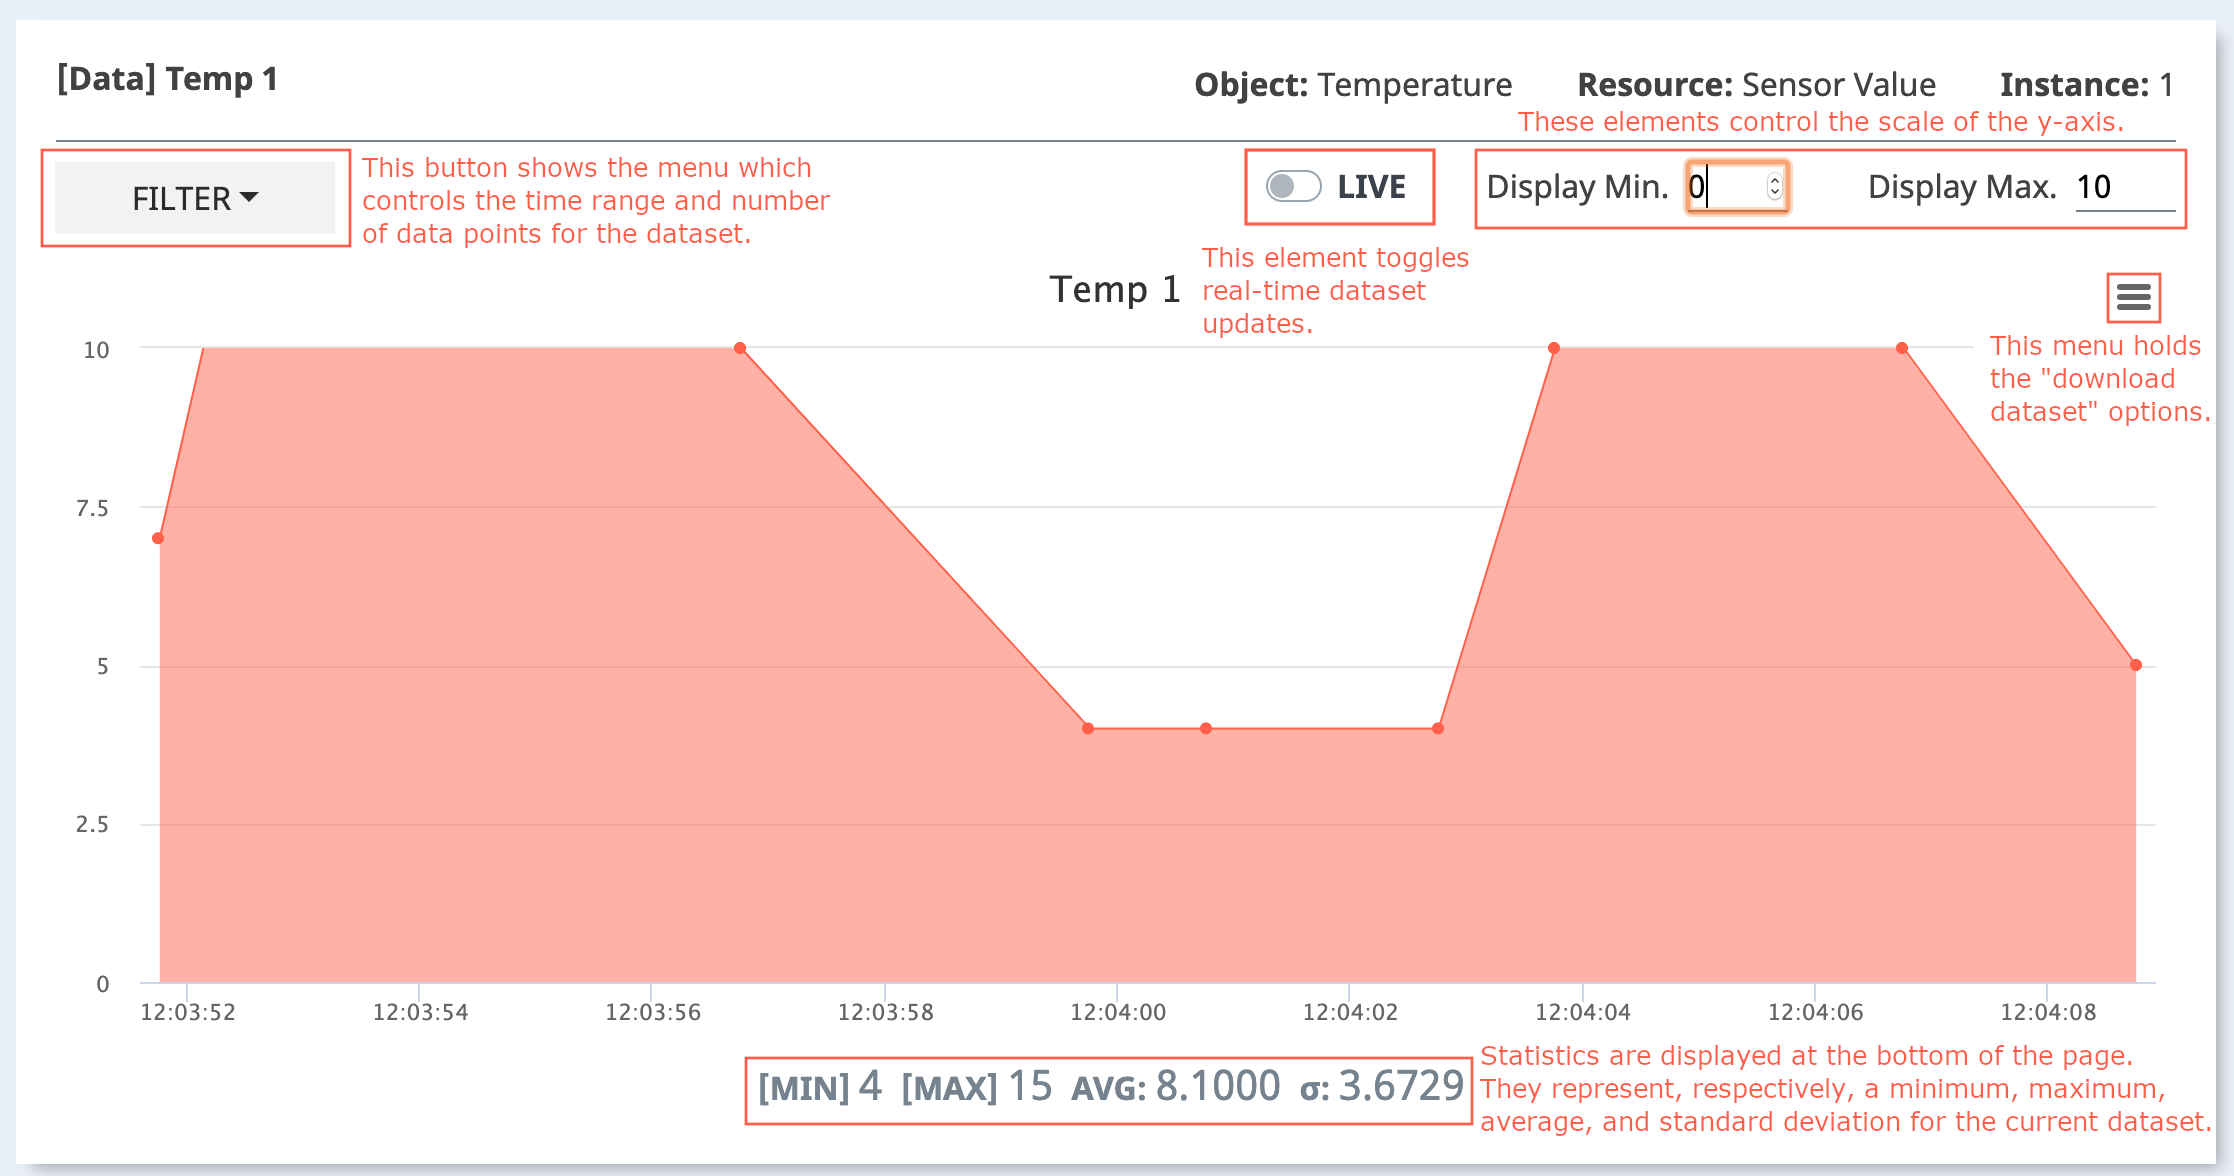
Beneath the Preview Chart, click "View Detailed Chart" to se an enhanced view.
The following image explains the detailed chart functionality:

In addition, when you focus on a data plot on the graph, the data value and unit string will be displayed on the tooltip.
Enable LIVE Mode to display graphs
Data sent from the device to the NEQTO Console can be displayed in real time on a graph. To enable LIVE MODE, click on the "LIVE" button to reveal the graph.
You can use LIVE mode without enabling Infinitypool, but the data will not be saved and the displayed data will be cleared when you reload the browser.
Enable Infinitypool to display graphs
If you want to display previously stored data in a chart, you must enable the Infinitypool.
To enable Infinitypool for a Group, please enable Infinitypool in the Group settings
When LIVE mode is used with Infinitypool enabled, the displayed data is not cleared when the browser is reloaded because the data is saved. Saved chart data can be downloaded from the preview chart or from the menu in the upper right corner of the detailed chart.
